Microsoft Project is a powerful software tool for project management professionals, containing a comprehensive set of features to plan, track, and manage projects of all sizes and complexities.
One of the key tools in Microsoft Project is the Gantt chart – a visual representation of a project’s timeline and tasks. In this article we will explore the fundamental aspects and importance of the Gantt chart, as well as how to make one with the Microsoft Project application. This in turn would help you streamline your project management processes faster and more efficiently.
How to make a Gantt Chart in Microsoft Project
- Click View > Gantt Chart.
- Enter task names and durations in the grid on the left.
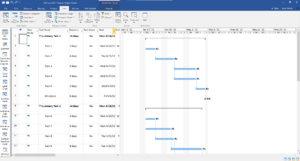
- The Gantt bars automatically appear on the timeline to the right.
Microsoft Project is a powerful software tool for project management professionals, containing a comprehensive set of features to plan, track, and manage projects of all sizes and complexities.
One of the key tools in Microsoft Project is the Gantt chart – a visual representation of a project’s timeline and tasks. In this article, we will explore the fundamental aspects and importance of the Gantt chart, as well as how to make one with the Microsoft Project application. This in turn would help you streamline your project management processes faster and more efficiently.
What is a Gantt chart?
A Gantt chart is a useful tool that visually shows all the tasks within a project plan over a timeline. Users can visualize the project architecture and see the timeframe of the tasks’ duration and time of completion. At the same time, they are able to monitor the project progress, and analyze resource allocation.
Due to the clear design of the Gantt charts, everyone can easily understand the project flow over time, what has been completed to date, and if there are potential delayed tasks in the project timeframe.
A Gantt chart can show:
- The tasks in the project
- The resources assigned on those tasks
- The tasks’ start and end times, duration of the tasks
- How the tasks are dependent between each other
The History of the Gantt chart
The history of the Gantt chart can be traced back to the late 19th and the early 20th century. The initial design was created by Karol Adamiecki, a Polish engineer and management researcher. He was constantly working on inventing new models on displaying interdependence processes, which would enhance the visibility of the production schedules, thus creating the first model of this concept we know today.
At the same time, Henry L. Gantt, a US mechanical engineer and management consultant developed his visual project management tool. The initial Gantt charts he introduced were meant to improve the efficiency of production in many industries, but predominantly in manufacturing and construction.
His primary goal was to provide a clear and intuitive way to schedule and track tasks within a project, helping managers and teams to coordinate their efforts more effectively. His idea became a success and today, the tool carries his name.
Henry Gantt’s innovation was to represent project tasks as horizontal bars on a timeline, with each bar indicating the start and the end date of a particular activity. The simple, yet powerful visualization allowed the then-project managers to quickly get familiarized with the project’s timeline, the dependencies between separate tasks, and the allocation of resources.
During World War I, the Gantt charts were widely used for military logistics and production planning. After the war, they were instrumental in the planning and the execution of large-scale projects in many industries.
Over the years, Gantt charts have evolved and incorporated various features and technologies, including computer software, which has made them an indispensable tool in the modern project management, used to plan, monitor, and control project tasks.
Gantt chart in Seavus Project Viewer
Gantt charts are an integral component in a wide array of software solutions and a popular way to present the work undertaken in a project. In addition to the Microsoft Project software, another useful tool that can help users to most efficiently show the most informative information from the project plan by using a Gantt chart is Seavus Project Viewer.
Seavus Project Viewer is the most complete software used as a viewer for .mpp files, allowing users to view project files created with the Microsoft Project software, without requiring an MS Project license.

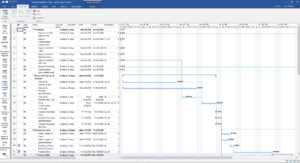
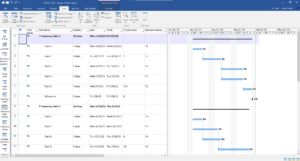
Gantt Chart in the Seavus Project Viewer application
The information presented in Seavus Project Viewer is visualized from the existing MPP file and is 100% accurate as seen in the original source of creation.
Gantt charts in Seavus Project Viewer allow project managers and their teams to:
- Have a graphical overview of the project tasks, while at same time having access to detailed information about each task.
- View key tasks marked as milestones, and see tasks as rolled-up bars for a clearer overview of the project.
- Analyze tasks duration, percentage of completeness, as well as slack and slippage between tasks.
- Visually analyze the progress of tasks on the timeline through baselines by comparing planned and present (actual start and finish) data.
- Review any changes made to tasks during levelling.
The Seavus Project Viewer software is an ideal solution for mid to large sized companies and organizations for efficiently disseminating and communicating project information with the entire project team. Not only does it help the organization to save costs on software licenses, but also equips every project participant with a view access to the project plan, allowing for improved communication and collaboration amongst all parties involved in the project.
The software is available for download in a 15-day trial version.
The application features 26 views, available with a single click of a button. Predefined views that allow visualization of project data through specific types of Gantt charts, that are also found within the Microsoft Project application are also included, such as:
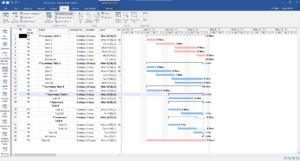
Detail Gantt – A type of a Gantt chart that displays the slack and slippage as thin bars between tasks to help audit the progress of a project.
Leveling Gantt – A type of Gantt chart where the left columns feature list of tasks and information about task delays, while the chart on the right side shows the state of tasks before and after the effects of leveling.
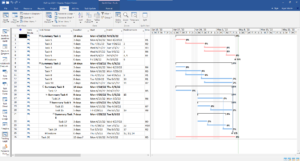
Tracking Gantt – A type of Gantt chart that displays two task bars for each task, one on top of the other, where the lower bar shows the baseline start and finish dates, and the upper bar shows scheduled (or actual) start and finish dates.
Multiple Baselines Gantt – A special type of Gantt chart that shows different colored task bars for the first three baselines.
Bar Rollup view – shows the subtasks grouped together and overlaid as bars on top of their summary tasks to have a better visibility when working with large projects.
Milestone Rollup view – Similar to the Bar Rollup view, the Milestone Rollup view shows the subtasks rolled up as milestones and overlaid on top of their respective summary task and the tasks name.

Milestone Date Rollup – This view shows the subtasks rolled up as milestones, same as the Milestone Rollup view, with the addition of displaying the tasks start dates, and not only tasks names.
Any additional Gantt chart views that are created in Microsoft Project, and stored within the .mpp file, will be available in the Seavus Project Viewer application as well.
Furthermore, same as with the MS Project application, a wide array of customization and formatting options related to the visual look and information contained within the Gantt charts are supported by Seavus Project Viewer, allowing users to choose the most efficient way to visually consume the needed project information.
Users can choose what task information they would like to be displayed on the Gantt bars, whether to show the links between dependent tasks and more. They can even change the timeline settings, color-code their tasks and bars, and personalize a variety of aspects on each chart.
The importance of Gantt charts
Gantt charts visualize key elements in the project schedule such as the tasks and their timeframe of completion and allow project managers and their teams to easily understand what work is being undertaken, by which project stakeholder and at what time.
They are helpful project management tools that assist project participants in making sure each deliverable is finished on time, which reflects in avoiding any missed deadlines and prevents potential delays and cost overruns.
Gantt charts also help project managers and their teams to visually analyze different elements of the project plan, monitor the project progress and activities on the critical path, determine the current status of the project, as well as bring decisions that will drive the project forward to successful completion.
They provide a clear and easily comprehensive overview of the project work across the timeline and help keep the work on the project aligned with everyone on the project team.
Nowadays, Gantt charts are also features in leading software solutions such as Microsoft Project and Seavus Project Viewer, who use the Gantt charts to visually present the project work and help organizations to efficiently manage projects.
In a world where time, resources, and deadlines can often make or break a project’s success, Gantt charts offer a structured approach to project management and bring control to the timelines. So, regardless of whether you’re managing a construction project, leading a software development team, or organizing the daily activities of a large production facility, Gantt charts can lead your project toward success any time.
Microsoft Project is a powerful software tool for project management professionals, containing a comprehensive set of features to plan, track, and manage projects of all sizes and complexities.
One of the key tools in Microsoft Project is the Gantt chart – a visual representation of a project’s timeline and tasks. In this article we will explore the fundamental aspects and importance of the Gantt chart, as well as how to make one with the Microsoft Project application. This in turn would help you streamline your project management processes faster and more efficiently.
How to make a Gantt Chart in Microsoft Project
Being familiarized with the layout and the functions that Gantt charts offer, our next step would be to explore creating Gantt charts in Microsoft Project.
Step 1: Open the Microsoft Project application.
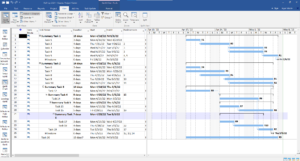
Upon opening the application, you will notice that the interface consists of two main panels. The left panel is reserved for the worksheet or columns where data such as tasks names, durations, start date, end date parameters are entered. The right panel is reserved for the Gantt chart, where the timeline is also displayed.
Step 2: Open a new blank Project in the Microsoft Project application.
Simply put, go to the File menu and choose to open a new project. Since you have opened a blank project, the next steps are to enter details about the project.
Step 3: Enter the Project Data.
Start planning your project. As you are inserting task parameters in the left panel, MS Project is planning your project by automatically generating the Gantt chart and calculating many project-defining parameters, such as timeframe, costs, and allocations.
At this point you can also define other important information about your project such as Milestones and organize your project by adding elements such as subtasks and linking the tasks according to your planned logic.
What is a Gantt chart?
A Gantt chart is a useful tool that visually shows all the tasks within a project plan over a timeline. Users can visualize the project architecture and see the timeframe of the tasks’ duration and time of completion. At the same time, they are able to monitor the project progress, and analyze resource allocation.
Due to the clear design of the Gantt charts, everyone can easily understand the project flow over time, what has been completed to date, and if there are potential delayed tasks in the project timeframe.
A Gantt chart can show:
- The tasks in the project
- The resources assigned on those tasks
- The tasks’ start and end times, duration of the tasks
- How the tasks are dependent between each other
The History of the Gantt chart
The history of the Gantt chart can be traced back to the late 19th and the early 20th century. The initial design was created by Karol Adamiecki, a Polish engineer and management researcher. He was constantly working on inventing new models on displaying interdependence processes, which would enhance the visibility of the production schedules, thus creating the first model of this concept we know today.
At the same time, Henry L. Gantt, a US mechanical engineer and management consultant developed his visual project management tool. The initial Gantt charts he introduced were meant to improve the efficiency of production in many industries, but predominantly in manufacturing and construction.
His primary goal was to provide a clear and intuitive way to schedule and track tasks within a project, helping managers and teams to coordinate their efforts more effectively. His idea became a success and today, the tool carries his name.
Henry Gantt’s innovation was to represent project tasks as horizontal bars on a timeline, with each bar indicating the start and the end date of a particular activity. The simple, yet powerful visualization allowed the then-project managers to quickly get familiarized with the project’s timeline, the dependencies between separate tasks, and the allocation of resources.
During World War I, the Gantt charts were widely used for military logistics and production planning. After the war, they were instrumental in the planning and the execution of large-scale projects in many industries.
Over the years, Gantt charts have evolved and incorporated various features and technologies, including computer software, which has made them an indispensable tool in the modern project management, used to plan, monitor, and control project tasks.
Gantt chart in Seavus Project Viewer
Gantt charts are an integral component in a wide array of software solutions and a popular way to present the work undertaken in a project. In addition to the Microsoft Project software, another useful tool that can help users to most efficiently show the most informative information from the project plan by using a Gantt chart is Seavus Project Viewer.
Seavus Project Viewer is the most complete software used as a viewer for .mpp files, allowing users to view project files created with the Microsoft Project software, without requiring an MS Project license.
Gantt Chart in the Seavus Project Viewer application
The information presented in Seavus Project Viewer is visualized from the existing MPP file and is 100% accurate as seen in the original source of creation.
Gantt charts in Seavus Project Viewer allow project managers and their teams to:
- Have a graphical overview of the project tasks, while at same time having access to detailed information about each task.
- View key tasks marked as milestones, and see tasks as rolled-up bars for a clearer overview of the project.
- Analyze tasks duration, percentage of completeness, as well as slack and slippage between tasks.
- Visually analyze the progress of tasks on the timeline through baselines by comparing planned and present (actual start and finish) data.
- Review any changes made to tasks during levelling.
The Seavus Project Viewer software is an ideal solution for mid to large sized companies and organizations for efficiently disseminating and communicating project information with the entire project team. Not only does it help the organization to save costs on software licenses, but also equips every project participant with a view access to the project plan, allowing for improved communication and collaboration amongst all parties involved in the project.
The software is available for download in a 15-day trial version.
The application features 26 views, available with a single click of a button. Predefined views that allow visualization of project data through specific types of Gantt charts, that are also found within the Microsoft Project application are also included, such as:
Detail Gantt – A type of a Gantt chart that displays the slack and slippage as thin bars between tasks to help audit the progress of a project.
Leveling Gantt – A type of Gantt chart where the left columns feature list of tasks and information about task delays, while the chart on the right side shows the state of tasks before and after the effects of leveling.
Tracking Gantt – A type of Gantt chart that displays two task bars for each task, one on top of the other, where the lower bar shows the baseline start and finish dates, and the upper bar shows scheduled (or actual) start and finish dates.
Multiple Baselines Gantt – A special type of Gantt chart that shows different colored task bars for the first three baselines.
Bar Rollup view – shows the subtasks grouped together and overlaid as bars on top of their summary tasks to have a better visibility when working with large projects.
Milestone Rollup view – Similar to the Bar Rollup view, the Milestone Rollup view shows the subtasks rolled up as milestones and overlaid on top of their respective summary task and the tasks name.
Milestone Date Rollup – This view shows the subtasks rolled up as milestones, same as the Milestone Rollup view, with the addition of displaying the tasks start dates, and not only tasks names.
Any additional Gantt chart views that are created in Microsoft Project, and stored within the .mpp file, will be available in the Seavus Project Viewer application as well.
Furthermore, same as with the MS Project application, a wide array of customization and formatting options related to the visual look and information contained within the Gantt charts are supported by Seavus Project Viewer, allowing users to choose the most efficient way to visually consume the needed project information.
Users can choose what task information they would like to be displayed on the Gantt bars, whether to show the links between dependent tasks and more. They can even change the timeline settings, color-code their tasks and bars, and personalize a variety of aspects on each chart.
The importance of Gantt charts
Gantt charts visualize key elements in the project schedule such as the tasks and their timeframe of completion and allow project managers and their teams to easily understand what work is being undertaken, by which project stakeholder and at what time.
They are helpful project management tools that assist project participants in making sure each deliverable is finished on time, which reflects in avoiding any missed deadlines and prevents potential delays and cost overruns.
Gantt charts also help project managers and their teams to visually analyze different elements of the project plan, monitor the project progress and activities on the critical path, determine the current status of the project, as well as bring decisions that will drive the project forward to successful completion.
They provide a clear and easily comprehensive overview of the project work across the timeline and help keep the work on the project aligned with everyone on the project team.
Nowadays, Gantt charts are also features in leading software solutions such as Microsoft Project and Seavus Project Viewer, who use the Gantt charts to visually present the project work and help organizations to efficiently manage projects.
In a world where time, resources, and deadlines can often make or break a project’s success, Gantt charts offer a structured approach to project management and bring control to the timelines. So, regardless of whether you’re managing a construction project, leading a software development team, or organizing the daily activities of a large production facility, Gantt charts can lead your project toward success any time.